Extraction of brain region (segmentation)
The standard brain (brain white map) constructed in the previous section is the base for registering the modular structure (neuropile) and neurons segmented from brain image. For example, by extracting a region using a brain image from which the outline of a targeted module structure can be observed and registering the result to the standard brain, a standard brain including the brain tissue can be obtained.
Module structures in the brain can be extracted (segmented) by using ITK-SNAP. Here, we show segmentation of glomeruler, which is a modular structure in the brain that processes information on odor processing of silkworm. The data to use is in the folder of Antennal Lobe in the data archive. Confocal image of antennal lobe's glomeruli are stored as ALsample1.img.
Note: ITK-SNAP is software developed in Europe and the US, and folder names and file names of data files can only use ASCII characters. Please note that you can not open the file if you give the Japanese name.
Step 1
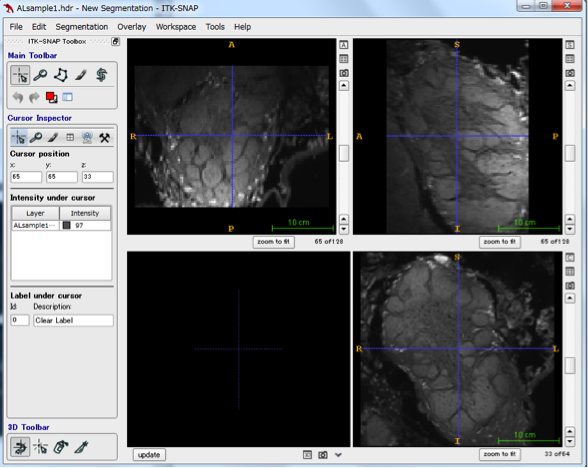
First, start ITK-SNAP and read the sample data file ALsample1.img. The file can be opened with File -> Open Main Image. When loading is done with Next → Finish, the image from 3 directions is displayed. By moving the scroll bar on the right side of each screen, I think that the glomeruli in the antenna leaf of Bombyx mori can be confirmed as a confocal image.

Step 2
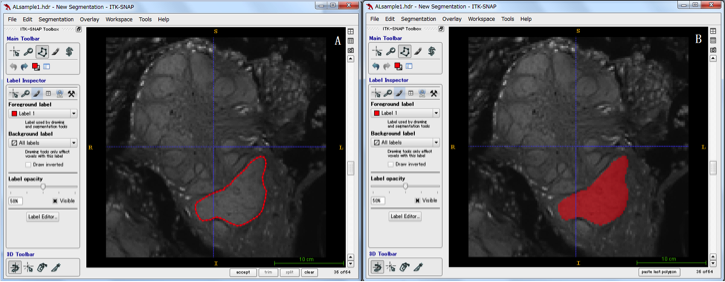
Let's introduce the method of segmentation actually using the contactor leafy oval sphere as an example. First of all, please confirm that confocal continuous images of glomerulus of antennae are displayed. Select the Polygon tool  on the Main Toolbar and trace the area to be extracted while dragging the mouse. If tracing is not completed, complete is displayed at the lower right of the screen, so click on it. To decide as an area, select accept and the enclosed area will be filled in. (The fill color can be selected appropriately, see below for adding labels.) Perform this operation until there is no structure for each image. The figure below traces the structure of a part of the globe sphere (region called a toroid), fills it with red by accept, and segments it. If you want to segment different structures, change Label at the bottom of Toolbox, pull down Active label of Sefgmentation Labels. In the initial setting, Label 1 to 6 are registered.
Adding and deleting labels
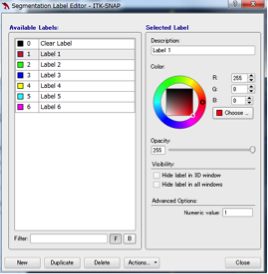
If there are six or more structures to be segmented and you want to add a Label or change the color of the extracted region, select Label Editor from the Segmentaion pulldown menu and add a new Label with New. You can select a color with Color of Selected Label, and change the name of Label with Description of Selected Label. To delete the entire label, select the level you want to delete from the Label Editor and click Delete. If you want to modify only a part of the label, select the appropriate label in Active label, select Paintbrush Mode, press the right button of the mouse and trace over the area you want to erase and erase the color, left Hold down the button and add colors.
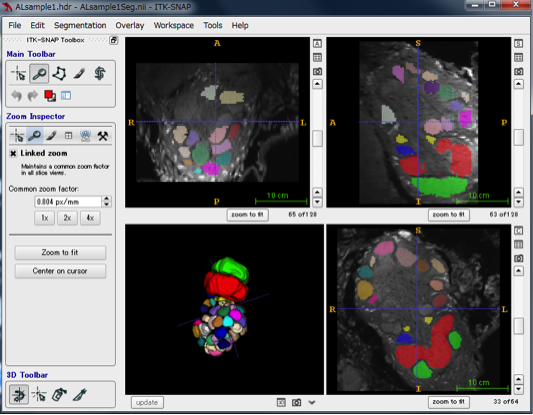
The figure below shows the result of segmenting multiple glomerular spheres in antennal lobe with different colors. The three-dimensional structure of the segmented area can be reconstructed with the update at the lower left of the 4-split screen, and it will be displayed as shown at the bottom left. You can rotate by dragging and see from various directions. The upper and lower right panels displaying images are images sliced from three different directions.
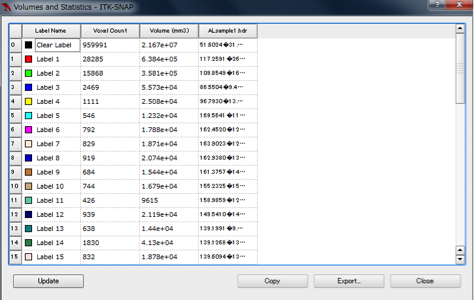
In ITK - SNAP, you can measure the volume of the segmented segmentation by Segmentation → Volumes and Statistics. In the volume column, the volume of each area is displayed.
Saving and loading segmentation results
The segmented data can be saved with Segmentation → save segmentation Image. For file format, select NIfTI (with extension of * .nii.gz for saving in compressed format recently) from the pulldown. An example of the result of the extraction is saved as ALsample 1 Seg.nii in the AntennalLobe directory.
When you do the work again, it reads the saved file in the next two steps. First, read the original image file *. Hdr or * .img, then Segmentation → open segmentation → browse → *. Nii. Select the file of the segmentation result by.
Note: Depending on the memory size of the computer you are using, the computer may freeze on the way, so it is a good idea to save it frequently.
 1. Construction of blank map |
 Construction of 3D standard brain map |
 3. 3D display of brain regions |